
Module Attributes Statistics

Introduction
This extension facilitates the presentation of diverse attribute values within pie charts, encompassing both percentage distributions and absolute counts. It possesses the capability to strategically apply attribute filtering, and the selections made are systematically stored in the cache, ensuring the persistently retained status of chosen items across distinct modules.
Use Cases and Features
Based on the functionalities and use cases that this extension is helping you with, the current version of the extension contains:
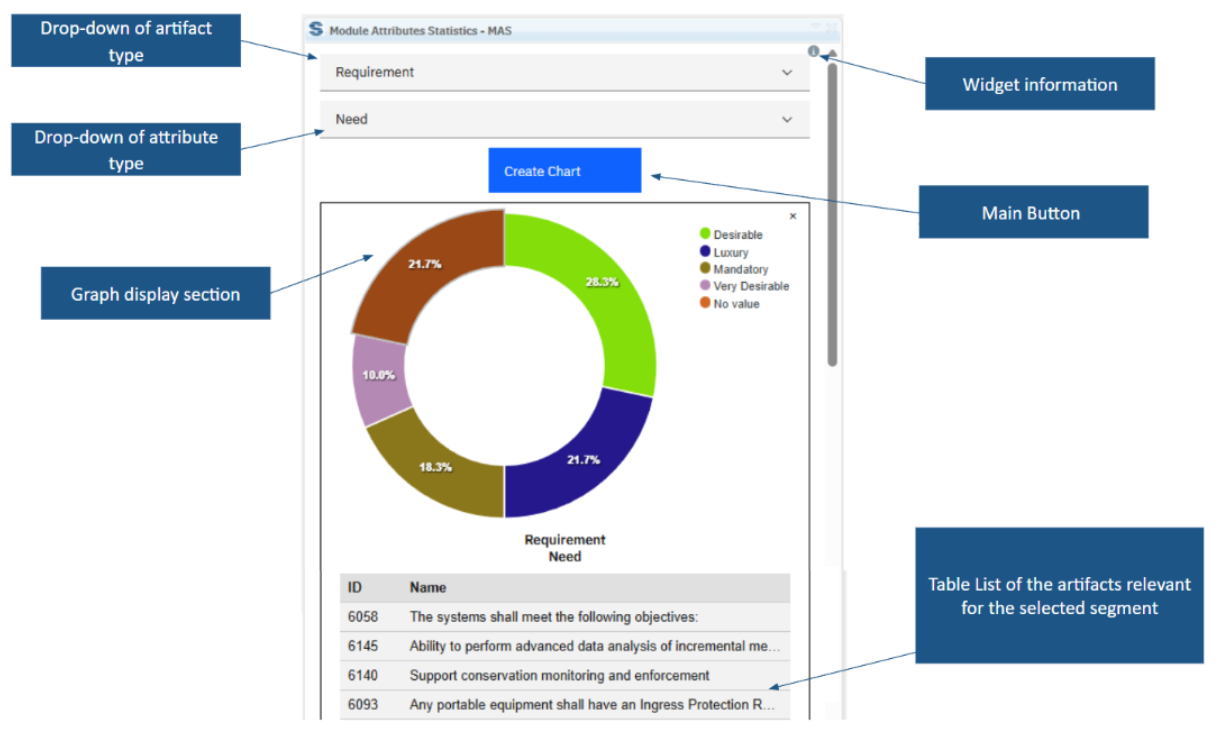
Widget information section - section with version, short description and other informations about the extension
Artifact type selection dropdown - drop-down menu for selecting an artifact type
Attribute selection dropdown - drop-down menu for selecting an attribute
Main button - after all necessary selections are made this button must be pressed to start an extension
Chart display section - in this section, created charts are displayed
Table List of the artifacts - when the user clicks a chart segment, a table appears below the chart showing the related artifacts, and each row can be clicked to jump to the selected artifact in the module.

1.) User Interface
This extension serves the purpose of providing a rapid and comprehensive module overview independent of the RS (Jazz Reporting Service - Report Builder) application. Notably, it provides the capability to autonomously identify the module's global configuration, affording users the convenience of seamless navigation between modules while minimizing setup prerequisites. Typically sought after by requirements engineers and managers, this extension fulfills the requirement for a visual depiction of the module's status by providing the following features:
Display visual pie charts - the extension provides the capability of generating visual charts after clicking on the “Create Chart” button, based on the selected artifact type and attribute.
Display multiple charts simultaneously - the widget is also capable of displaying multiple charts based on the user's needs.
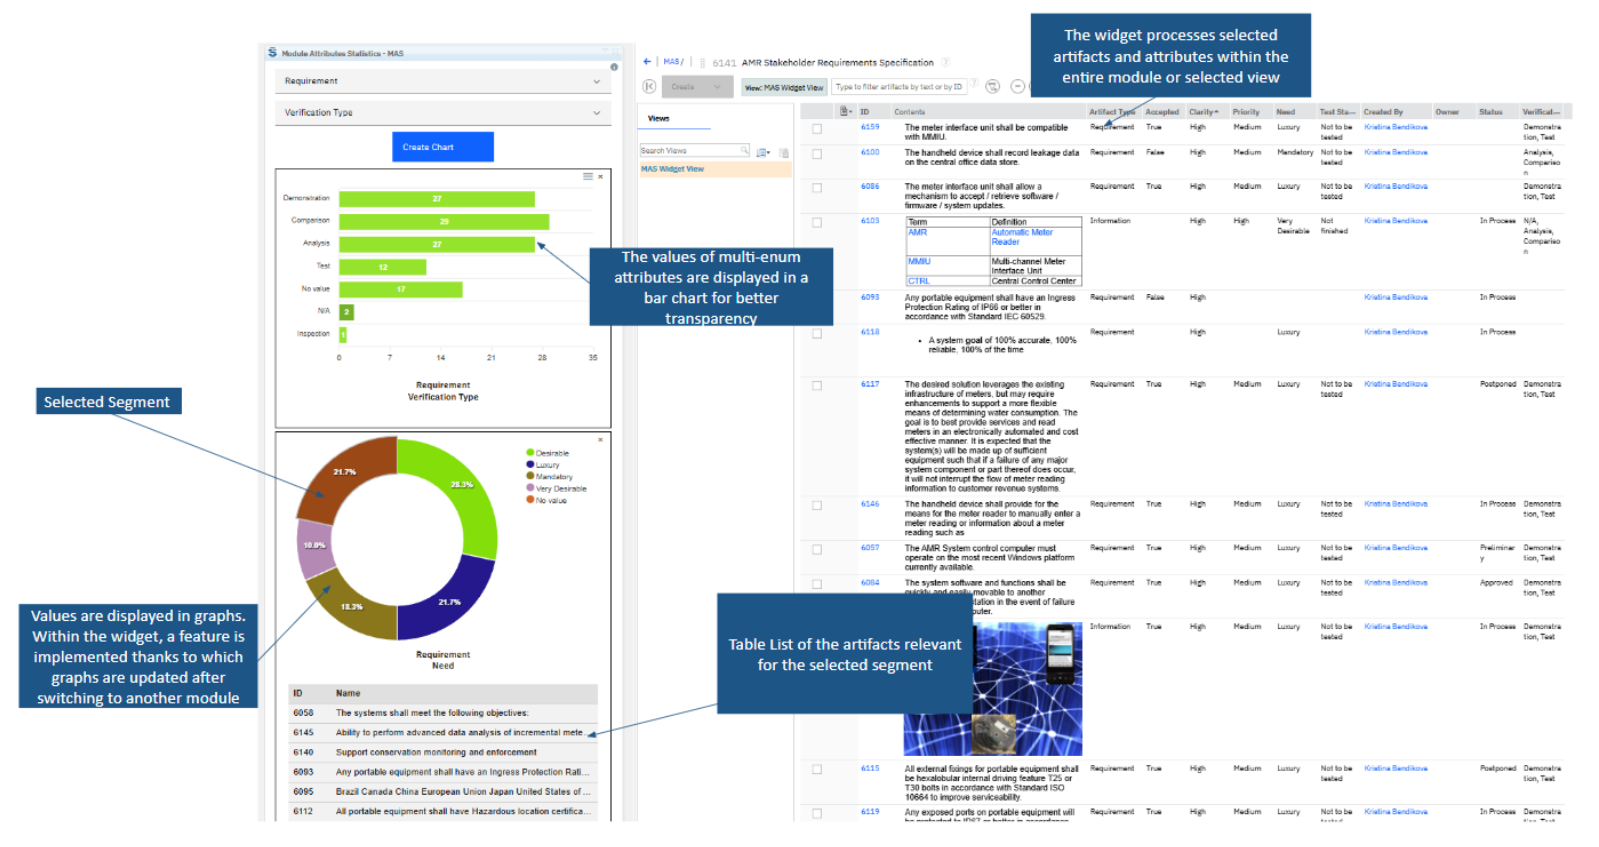
Include enumeration attributes in bar graphs - in addition to pie charts, this extension accommodates the presentation of multiple enumeration attributes through the use of bar graphs. This expanded capability provides a more comprehensive visualization of the data distribution.
Interaction with Chart Segments (Artifact List Display) - each segment of charts is interactive. When the user clicks on a segment, a table listing the relevant artifacts appears directly below the chart.
The table includes ID and Name columns.
If an artifact name is too long, it is truncated with “...”. Hovering over the row for more than two seconds will show a tooltip with the full name.
- Interaction with Chart Segments (Jump to Artifact) - each row in the table is clickable. Clicking on a row will open and select the corresponding artifact in the module view, allowing for seamless navigation.
- Cache storage for requests - Users can designate charts of interest, and the widget systematically archives these selections within the cache. This stored information remains accessible for subsequent visits to the module, obviating the need for repeated setup.
- Seamless module transition - this extension enables seamless exploration across multiple modules, bypassing the necessity for recurring setup procedures. This versatile feature extends to facilitating navigation between streams, allowing for a swift transition between modules. Moreover, if the module in question contains identical artifact types and attributes, the chart reflects real-time updates specific to that module.
Integration with changesets - this extension seamlessly integrates with changesets, allowing users to efficiently manage and visualize the evolution of data over time. This capability enhances the understanding of data dynamics and facilitates informed decision-making processes.

2.) Short Description of the Extension's Functionality
Preconditions and Restriction
This extension is designed to work exclusively within the module. If the user does not meet this prerequisite, the widget displays an informative message.
The extension allows the creation of pie and bar charts of only user-related attributes, enumerations and booleans.
Sign up to our newsletter
Our Services
Our Extensions
Latest blog articles
Contact Us!
Softacus Services
Check out services!
We, in Softacus, are experts when it comes to consulting and service delivery of IBM software products and solutions in your business. We help our clients to improve visibility and transparency when licensing and managing commercial software, providing measurable value while increasing efficiency and accountability and we are providing services in different areas (see Softacus Services).
IBM ELM extensions developed by Softacus are free of charge for the customers who ordered IBM ELM licenses via Softacus or for the customers who ordered any of our services. If you are interested in any of our IBM ELM extensions, you found a bug or you have any enhancement request, please let us know at info@softacus.com.
